Activity 5:: Data Analysis
a) Review data gathered last week and identify any qualitative and any quantitative data in your data set
b) Is there any qualitative data that could be sensibly be translated into quantitative measures? If so do the translation and add data to your quantitative set.
c) Consider the quantitative data
a. Decide how best to enter quantitative data in spreadsheet and generate graphs
b. Is there any data that simple measures such as percentages or averages will be helpful? If so calculate the three different types of average
d) Consider your qualitative data
a. Based on your refinements of study question ‘ improving the product’ identify some themes from the qualitative data eg features causing most difficulty, were there any suggestions? Refine your themes and collate extracts of data, which support the theme.
b. Identify any critical incidents in your data. This may arise from interview, observation etc. Describe these incidents carefully and choose one or two to analyze in more depth focusing on the context in which they occurred
e) Collate findings as presentation and deliver to group of peers
f) Review your presentation and any questions received from peers and consider where analysis and presentation could be improved
Based on the original UWSMUG Project proposal UWSMUG will provide general news and information available to the public as well as resources stored in specific password protected areas of the site using Access Control Lists (ACLs) for staff and students including -
* Forums
* Events Calendars
* Latest News
* FAQs
* Tutorials
* Photo Galleries
* Podcasts
* RSS Feeds
* Web based applications and widgets
a) Last week data was gathered in relation to the structure of the navigation within the UWSMUG site.
This data was quantitative rather than qualitative. It did however present a clear picture of the preferred navigation structure based on a percentage of votes for a given structure. The final structure chosen for the UWSMUG web site matches this selection.
b) There was no specific qualitative data however based on the results it can be seen that in certain areas there was a hundred percent agreement. From this data it can be concluded that these items are in the most approved category. These choices could sensibly be translated into quantitative measures for further analysis. While WebSort presented some interesting data to properly analyze the data Excel would be a better option.
c) Consider the quantitative data
a. Given that there were only 4 respondents it is best to enter quantitative data manually in spreadsheet and generate graphs
First of all identify the popularity of each selection.
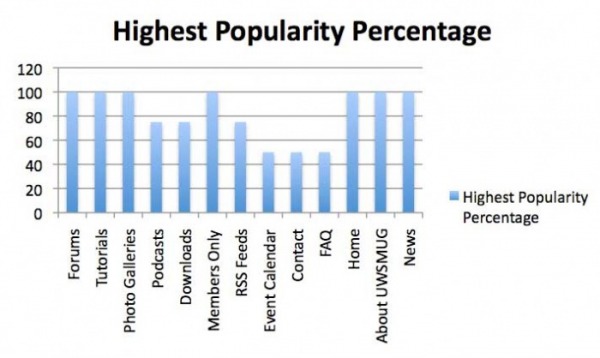
As can be seen there is a hundred percent agreement on 7 of the 13 choices.
The outstanding issue are the 3 choices with only a 50% popularity. These will require further investigation
b. Luckily the WebSort data provides simple measures of percentages which are helpful letting me know what other choices were considered equally as popular. However since these choices were split evenly 50/50 delving into determining the three different types of average would not produce anything meaningful.
d) Consider your qualitative data
a. One piece of qualitative data not previously discussed is my own personal experience as a web developer for more than 15 years. I have years worth of feedback from customers on topics such as features causing most difficulty, listening to suggestions etc..
b. When it came down to it I relied on my personal experience and observations of structures of similarly set-up MUG sites when making my final decision. Either way the choice only referred to whether the Event Calendar, Contact and FAQ items appeared at a top level or second level menu item. Considering Joomla’s ease at changing menu levels on the fly it was not considered a major issue.
e) Due to time constraints I have only presented my findings with a couple of other students for feedback.
f) Given a wider group of people to review my presentation I am sure there will be more questions arising, so my recommendation is that a follow up questionnaire amongst UWSMUG Members in 3 months be set-up to see if the new data matches our initial preliminary results
Summary
Due to the type of data being gathered only limited analysis could be carried out, however with the surveys set up at SurveyMonkey, providing people respond I will have much more useful data to analyze
Research Literature Sample | Introduction to Literature Searching | Answer an Online Survey |
Creating an Online Survey | Data Analysis:
